Lighthouse on a schedule, without the babysitting.
Everyone runs Lighthouse once. Almost nobody runs it every day, on every page, and keeps the history. Raptify does exactly that: scheduled Lighthouse audits with median-smoothed scores charted over time, plus Axe and Coach in the same run.
How it runs
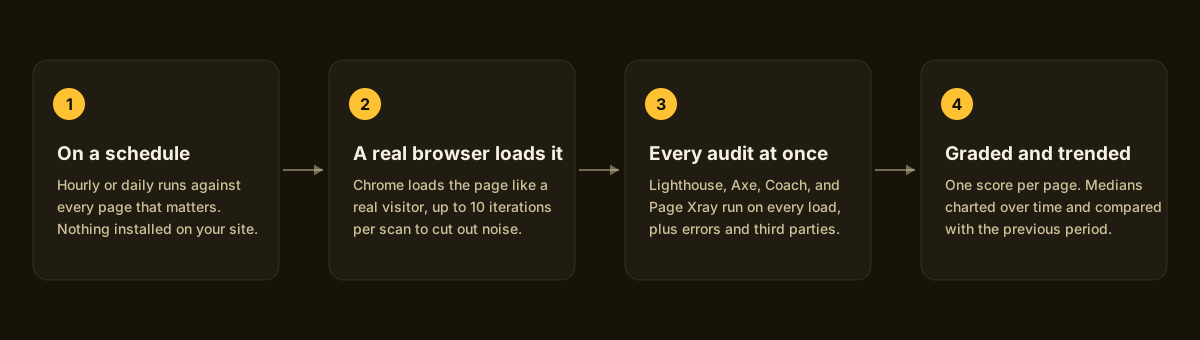
A real Chrome browser, every audit, every run.
No GitHub Action to babysit, no headless farm to run, no flaky CI step to re-trigger. Point Raptify at a URL and the audits run on a schedule from then on.
Beyond a single score
All four categories, tracked as trends.
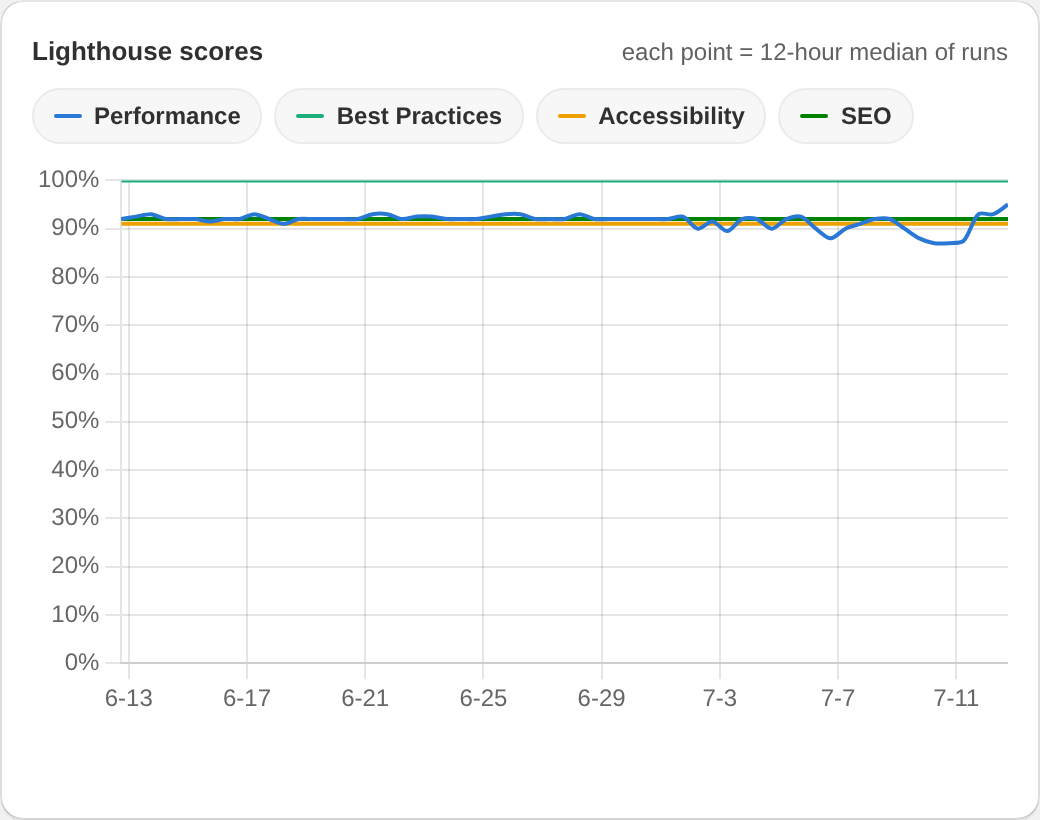
A single Lighthouse run swings with network weather and server load, which is why one-off scores start arguments instead of settling them. Raptify treats every score as a time series.
- Performance, Best Practices, Accessibility, and SEO charted together, with a clickable legend.
- Each chart point is a 12 hour median of real runs, so the line moves when the site changes, not when the network hiccups.
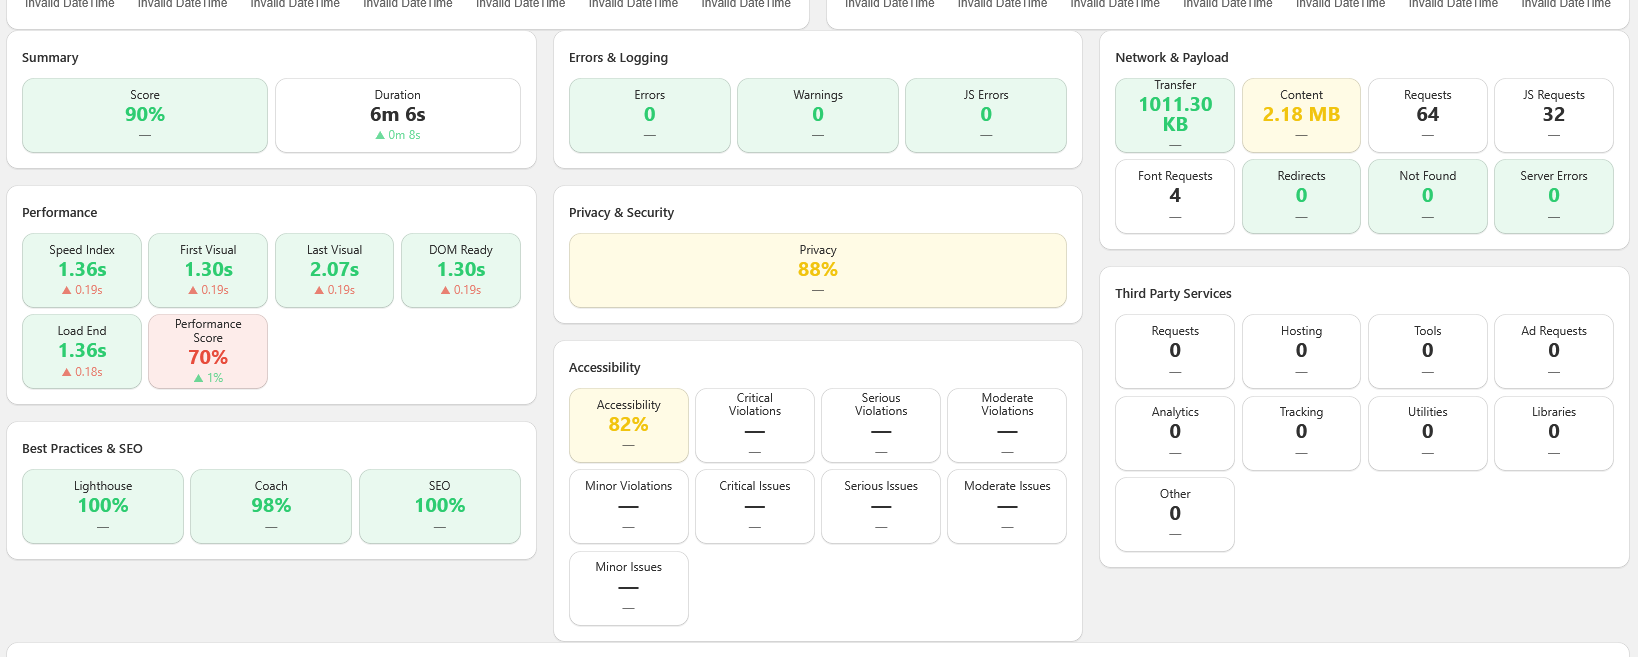
- Every scan also runs Axe accessibility and Sitespeed Coach audits, so you see exactly which audit slipped after a deploy.
- Full run history with every raw score, one click from the chart.
Reports you can trust
A graded report, not a wall of numbers.
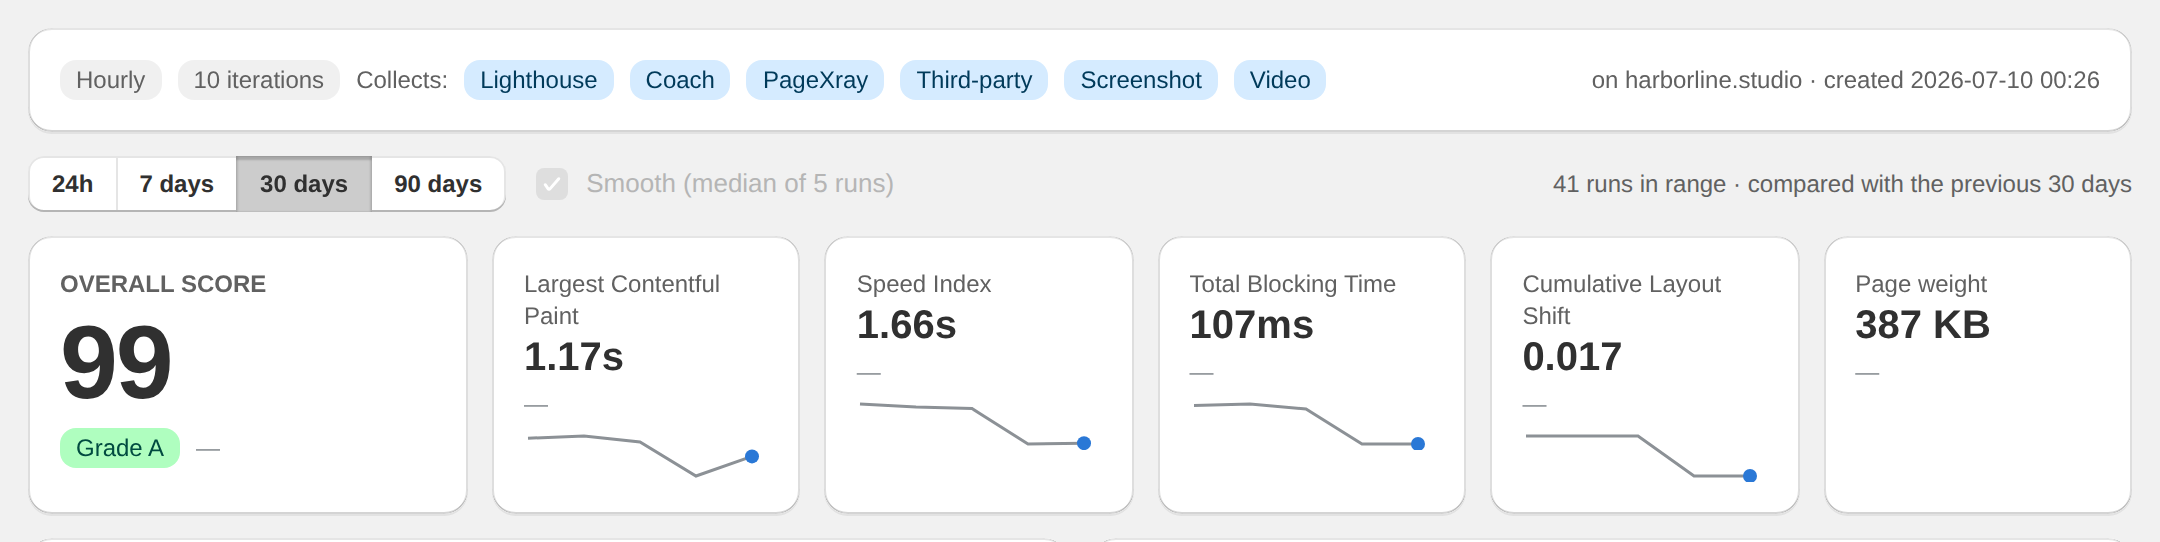
Scores roll up to one grade per page, and every metric carries a delta against the previous period. When someone asks "did the redesign make us slower", the answer is a screenshot, not an investigation.
- One overall grade per page, backed by every underlying metric.
- Pick any window from 24 hours to 90 days and compare it with the period before.
- If a run could not collect every signal, the score is flagged as partial data instead of quietly guessing.
Questions
Lighthouse monitoring, answered.
How is this different from running Lighthouse in DevTools?
Same audit engine, different discipline. DevTools gives you one number from one run on your laptop, colored by your extensions and your network. Raptify runs from a consistent environment on a schedule and keeps the history, which is what makes a score meaningful.
Is this Lighthouse CI?
No, and you do not need it to be. Lighthouse CI is a great tool if you want to build and maintain the pipeline yourself. Raptify is the hosted version of the same idea: no config repo, no CI minutes, no server, and it also runs Axe, Coach, and Page Xray in the same pass.
Why do my Lighthouse scores bounce around?
Variance is inherent: network conditions, server load, third party scripts, and CPU contention all move the score. That is why Raptify runs up to 10 iterations per scan and charts medians. A single run is an anecdote; a median trend is evidence.
Which pages should I monitor?
The pages that make you money: home, your top landing pages, a representative product or content page, and checkout or signup. Each one gets its own schedule, trend history, and grade.
Stop running Lighthouse by hand.
Tell us about your site and we will set you up as early access opens.