Track Core Web Vitals over time, not once a quarter.
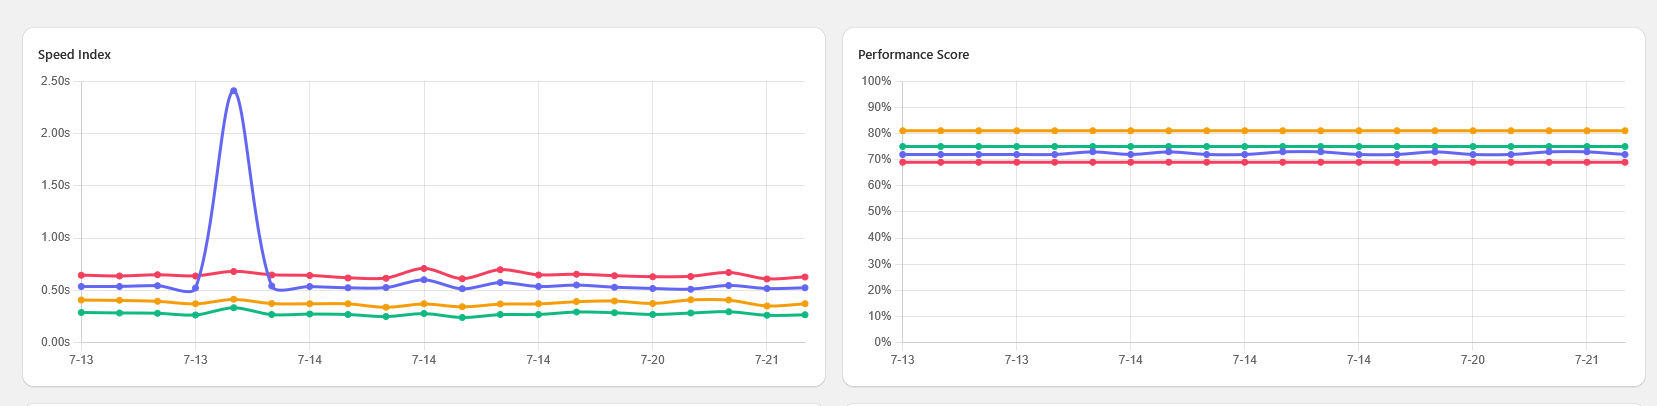
Raptify loads your pages in a real Chrome browser on a schedule and charts LCP, CLS, Total Blocking Time, FCP, and TTFB as trend lines. A regression shows up the next morning as a bend in the chart, not three weeks later as a drop in rankings.
The 60 second version
What Core Web Vitals actually measure.
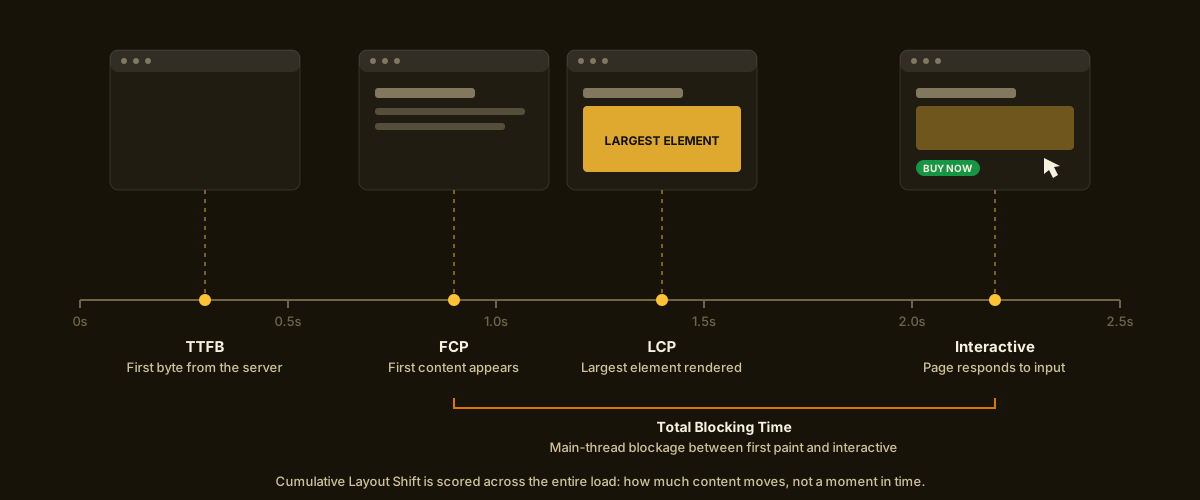
Google grades every page on how fast it paints, how quickly it responds, and how stable it looks while loading. Those grades feed search ranking. Here is where each metric lands during a page load.
How Raptify measures
Lab-grade numbers, on a schedule.
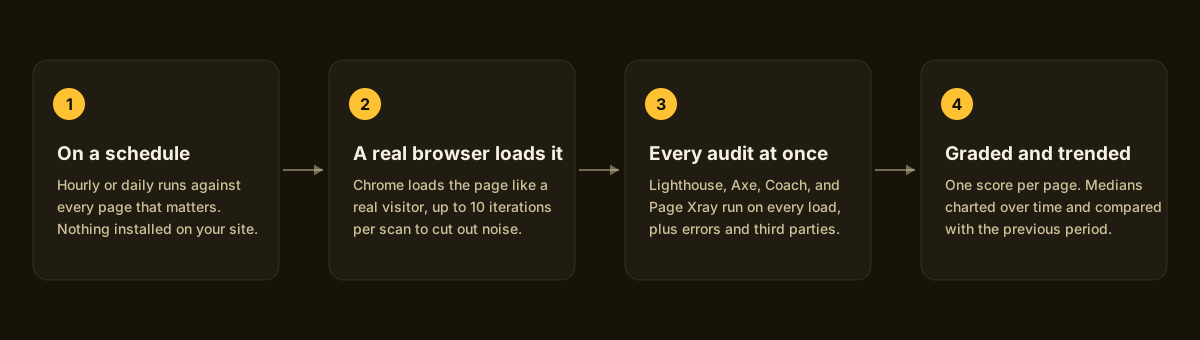
Every scan is a real browser loading your real page, repeated up to 10 times, with the median kept. No estimates, no extrapolation from someone else's traffic.
Trends, not snapshots
One Lighthouse run lies. A median trend cannot.
Core Web Vitals are noisy. The same page can score 85 and 95 two minutes apart depending on network weather and server load. Raptify is built around that reality.
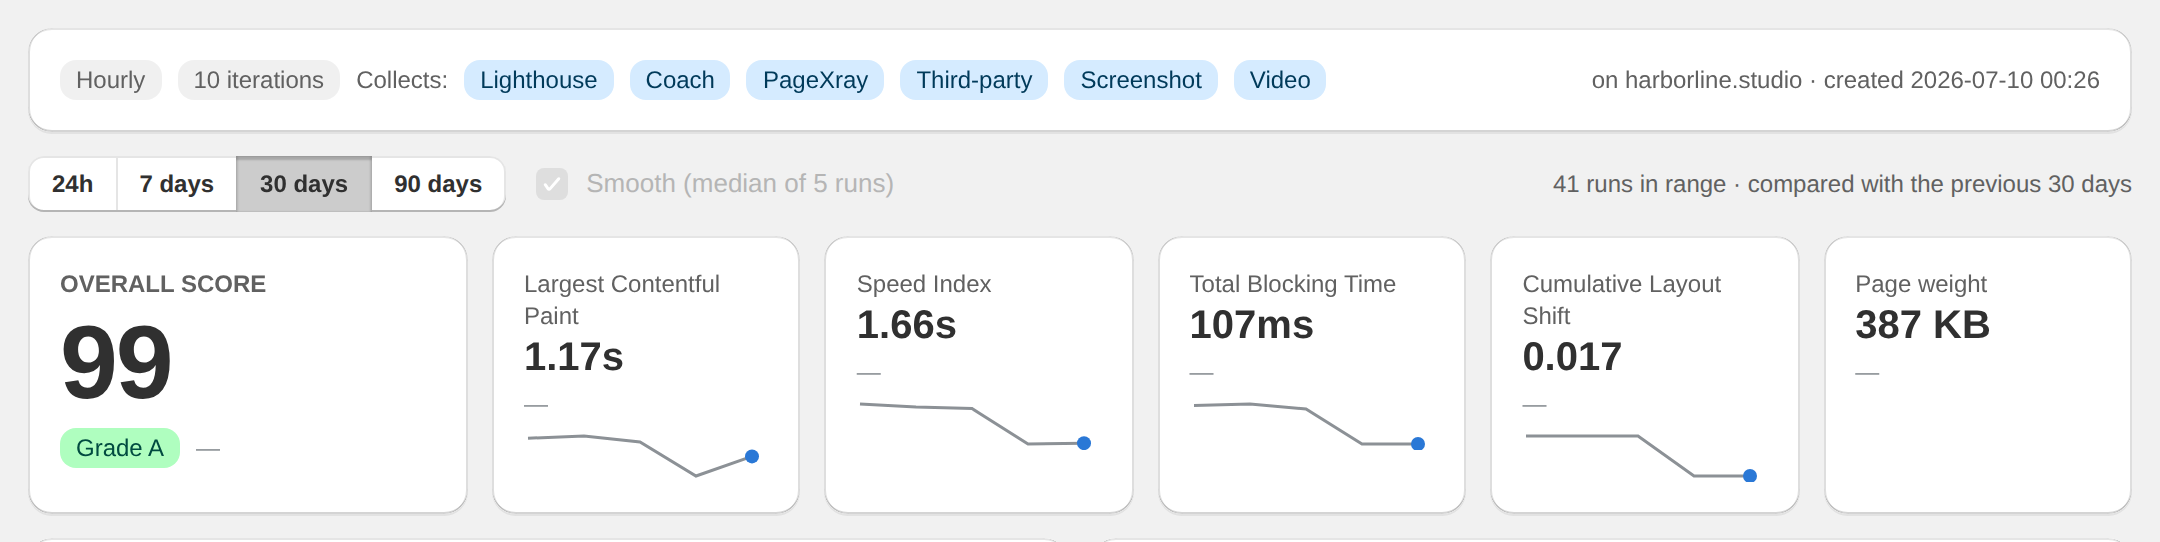
- Up to 10 iterations per scan, keeping the median so one slow fluke never fakes a regression.
- Rolling median smoothing across runs, with each chart point a 12 hour median.
- Pick any window from 24 hours to 90 days and compare it against the previous period.
- A clickable legend isolates any vital when you need to chase one number.
Questions
Core Web Vitals monitoring, answered.
How is this different from Search Console or CrUX?
Search Console shows field data aggregated over a rolling 28 day window, so a regression takes weeks to surface and weeks to clear. Raptify is lab data on your schedule: the same page, the same browser, every day or every hour, so you see the change the morning after it ships.
Do Core Web Vitals really affect rankings?
Yes. Google uses page experience signals, including Core Web Vitals, in search ranking. They also correlate strongly with conversion: slower LCP and janky layout shift measurably cost sales on commerce sites.
Do I need to add a script to my site?
No. Raptify loads your pages from the outside in a real Chrome browser, exactly the way a visitor does. There is no snippet, no tag, and nothing that could itself slow the page down.
Which metrics are tracked?
Largest Contentful Paint, Cumulative Layout Shift, Total Blocking Time, First Contentful Paint, Time to First Byte, Time to Interactive, and Speed Index, plus full Lighthouse category scores and page weight on every run.
Put your Core Web Vitals on a chart.
Tell us about your site and we will set you up as early access opens.