Performance monitoring built for fast online stores.
Raptify watches every page that matters, every day. Continuous Lighthouse, Axe, and Coach audits with trend tracking, so a regression shows up the next morning, not three weeks later when sales dip.
Two ways to run Raptify
Same product. Pick how you want to buy and manage it.
Same scanner, same dashboard, same metrics. The only real difference is billing and management: integrated into your Shopify stack, or standalone.
For Shopify stores
In App Store reviewInstall via the Shopify App Store. Billing on your Shopify invoice, managed alongside your other apps. No theme edits, no scripts, no developer required.
See the Shopify pitchFor any other website
Coming soonEmail signup, Stripe billing, standalone dashboard. Point Raptify at any URL and scan as many sites as you want.
See the standalone pitchWhat Raptify watches
Every signal that affects how fast your store actually feels.
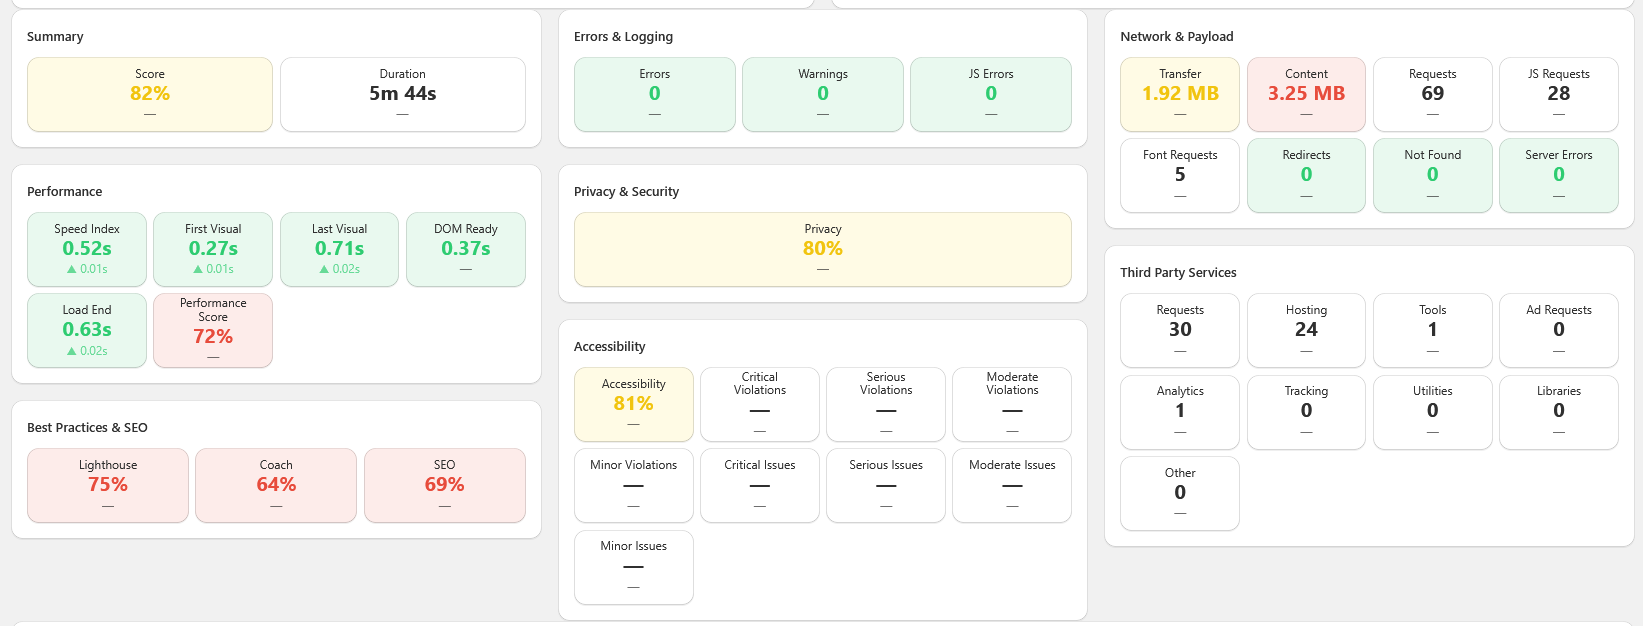
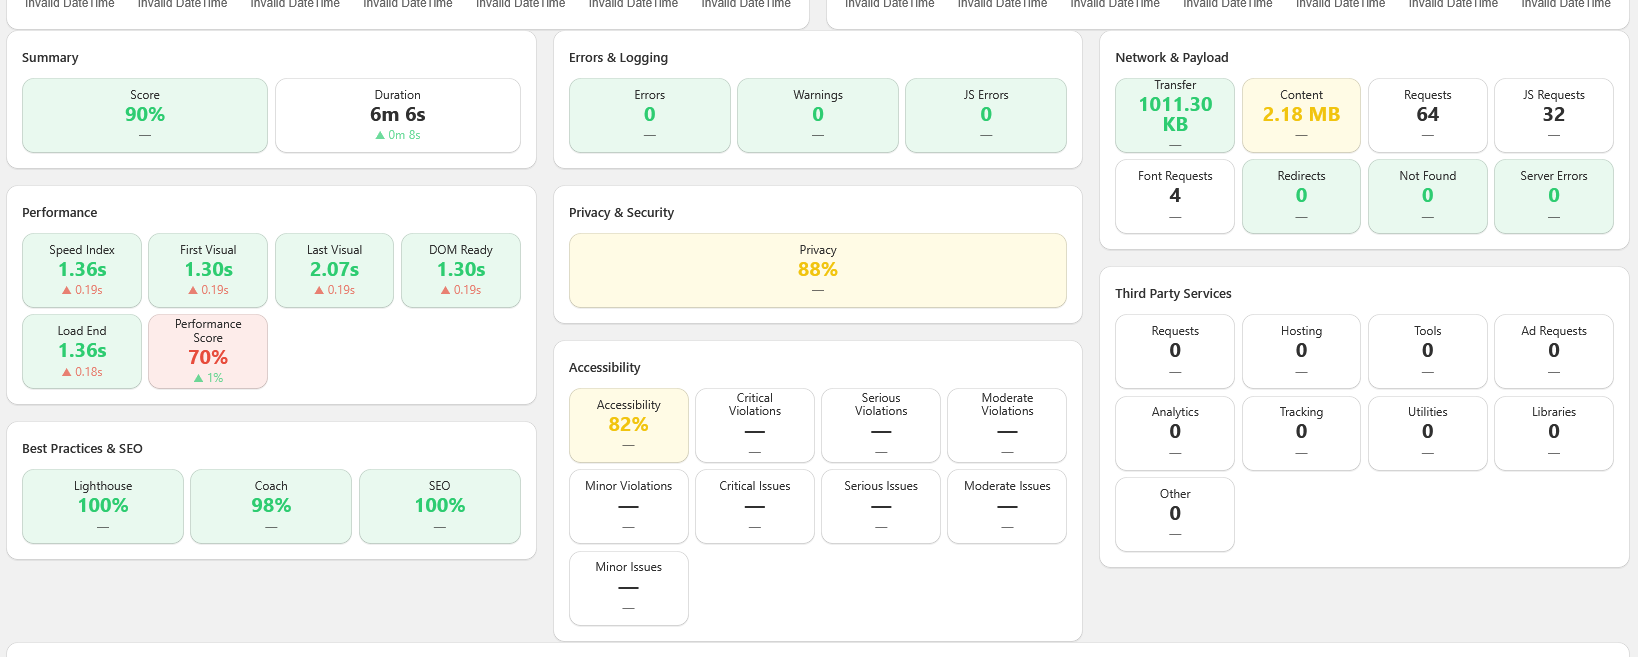
One run covers Core Web Vitals, third party scripts, accessibility, errors, and privacy. No DIY scripts, no toggling between tools.
Core Web Vitals and Speed Index
First Contentful Paint, Largest Contentful Paint, Cumulative Layout Shift, plus Speed Index, Performance Score, and DOM ready time. Tracked over time so trends are obvious.
Lighthouse, Axe, and Coach
Three real audits on every run. Lighthouse category scoring, Axe accessibility violations, and Sitespeed Coach recommendations. See exactly which audit slipped after a deploy.
Third party services
Requests, hosting, tools, ad calls, analytics, tracking, utilities, libraries. See what new third parties shipped after the last deploy.
Errors, broken links, and SSL
JS errors, warnings, server errors, redirects, and broken links, plus a daily SSL grade for every host. Surface the broken pages your team has not noticed yet.
Network and payload
Transfer size, content size, request count, font requests, and JS request volume. Page Xray captures the full request and content breakdown for every load.
Privacy and accessibility
Privacy scoring on every run, plus Axe accessibility audit results tiered Critical to Minor. Catch violations before they hit production.
More reliable than manual checks
Run a real audit on your store, on a schedule, automatically.
Most "performance monitoring" is one of two things: a status page that pings your homepage, or a Lighthouse run somebody does once a quarter. Neither catches the regression that costs you conversions.
- Daily checks across every URL that matters, with hourly available when you need it.
- Every metric compared with the previous period, so "slower than last month" is a fact, not a feeling.
- Up to 10 iterations per scan to cut noise out of the metrics.
- Page Xray captures detailed request and content metrics for each load.
See every change that matters
Trends, not snapshots.
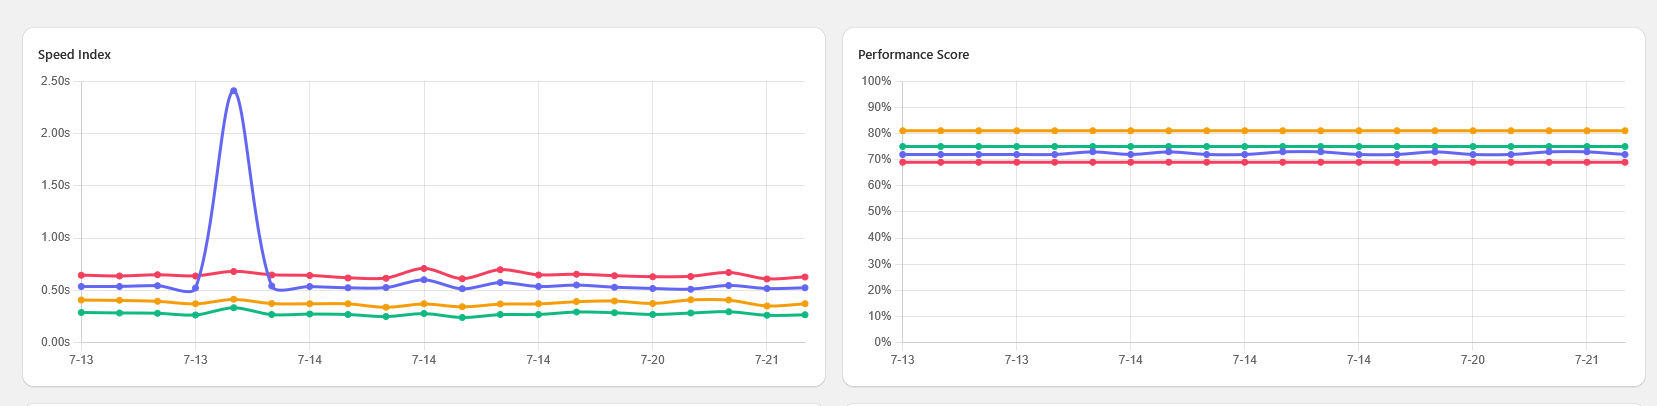
Raptify charts every metric over time so a slow Tuesday is impossible to ignore. Spike on Speed Index? Drop in performance score? Watch it build over the weeks instead of finding out the quarter sales dipped.
- Trend lines for Lighthouse scores, load timings, and Core Web Vitals, with a clickable legend to isolate any series.
- Rolling median smoothing charts the median of 5 runs, so one slow fluke never fakes a regression.
- Pick any window from 24 hours to 90 days and compare it against the previous period.
- Screenshots on every run; video capture available on higher plans for layout shift detection.
Reports you can trust
One honest score, backed by every metric.
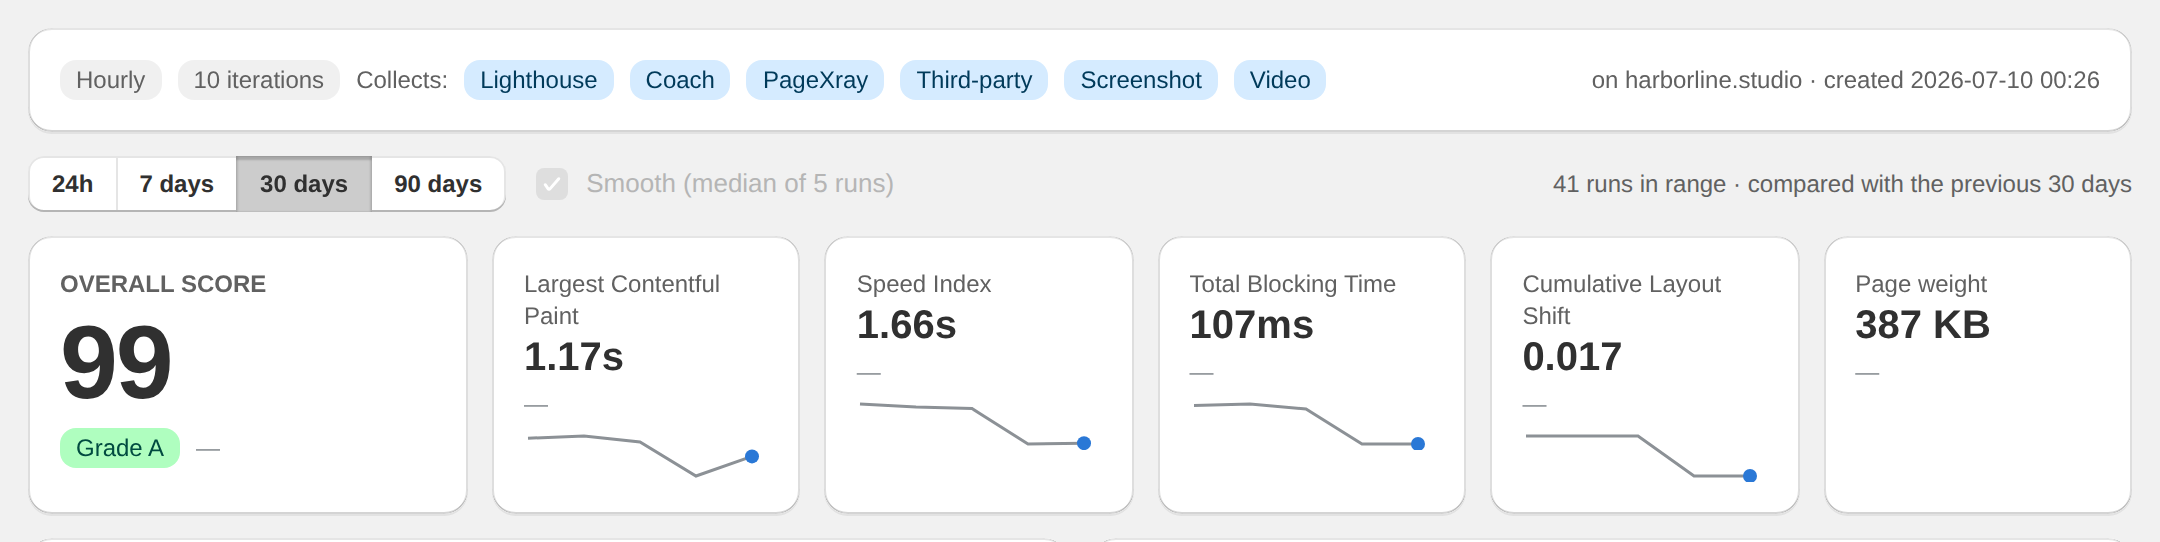
Every monitor rolls up to a single graded score, then shows its work: Largest Contentful Paint, Speed Index, Total Blocking Time, layout shift, and page weight, each with its own trend and delta against the previous period.
- An overall grade per page, so anyone on the team can read the report in one glance.
- Every card carries a sparkline and a comparison with the previous period.
- If a run could not collect every signal, the score is flagged as partial data instead of quietly guessing.
Why teams choose Raptify
Designed for the way performance actually breaks.
Generic monitoring catches outages. Raptify catches the regressions that bleed conversions while everything looks "up". Less noise, more signal, faster fixes.
Continuous monitoring
Set it once. Raptify watches every page and every SSL certificate on a schedule and rolls it up to one health view, so a regression is impossible to miss the next morning.
Real audits, not synthetic pings
Lighthouse, Axe, and Coach run end to end on every scan. Real browser, real metrics, the same audits Google uses to decide search ranking.
Detailed root cause data
Page Xray, third party breakdowns, and full request waterfalls so you can hand a developer a ticket, not a hunch.
QA visual capture
Screenshots on every run; video capture on higher plans. Catch layout shift, broken images, and visual regressions.
Privacy and compliance
Privacy scoring across runs. See what new cookies and trackers shipped after every deploy.
No code changes
No theme edits, no JS snippet, no developer required. Just point Raptify at your URL.
Get an early look at Raptify.
Drop your email and we will reach out as early access opens. Prefer to say more? Use the contact form.